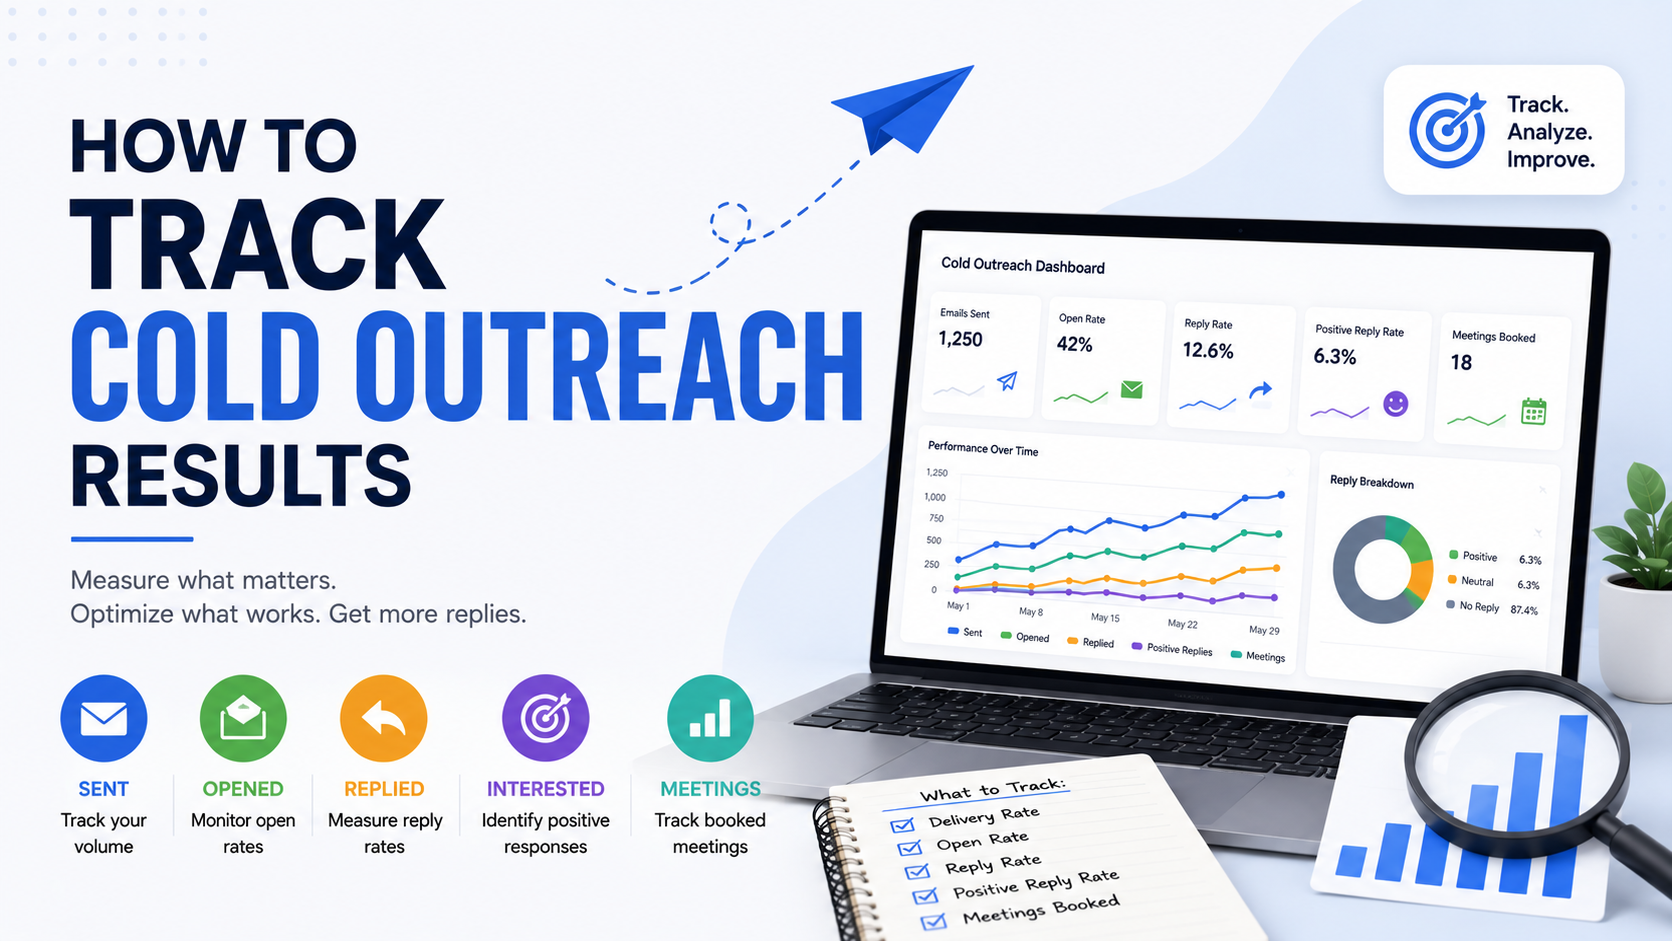
The first cold outreach campaign I tracked was a mess.
I knew how many emails I had sent.
I knew a few people had replied.
I knew one meeting had been booked.
But when someone asked me a simple question — “Which part of the campaign is actually working?” — I did not have a good answer.
Was the list good?
Was the subject line good?
Were follow-ups generating the replies?
Were people opening the emails but ignoring the offer?
Was one industry performing better than another?
I had activity, but I did not have useful data.
That is the difference between sending cold outreach and actually running an outbound system.
You do not need an expensive analytics stack to track results properly. A spreadsheet can work when you are starting out.
What matters is knowing which numbers help you make better decisions.
Because cold outreach becomes expensive very quickly when you keep scaling something that is not working.
Start With the Outcome, Not the Dashboard
One of the easiest mistakes is tracking whatever your outreach software happens to show.
You open the dashboard and see:
Emails sent.
Open rate.
Click rate.
Replies.
That feels like reporting.
But it may not tell you whether the campaign is making money.
The first question I ask now is:
What am I actually trying to achieve?
For most B2B campaigns, that might be:
Book qualified sales calls.
Generate quote requests.
Start conversations with decision-makers.
Create sales opportunities.
Win customers.
If that is the goal, your reporting should work backward from it.
A campaign with a high open rate but zero qualified conversations is not performing well.
A campaign with a modest reply rate but three profitable customers may be excellent.
The Basic Cold Outreach Funnel
I like to think about cold outreach as a simple funnel.
It might look like:
Prospects added
Emails sent
Emails delivered
Replies
Positive replies
Qualified conversations
Meetings booked
Meetings attended
Opportunities
Sales
Revenue
Each stage answers a different question.
If delivery is poor, you may have a data or deliverability problem.
If delivery is strong but replies are weak, the problem may be targeting, messaging, or the offer.
If replies are good but very few become meetings, your qualification or CTA may be weak.
If meetings are happening but nobody buys, the problem probably is not your cold email anymore.
That is why tracking the entire funnel matters.
Metric #1: Prospects Added
This sounds basic, but I track how many actual prospects enter the campaign.
Not email addresses.
Prospects.
If one company has three contacts, I want to know whether I am measuring three people or one account.
This becomes especially important in account-based outreach.
Suppose you target 100 companies and contact two people at each one.
That is:
100 target accounts.
200 individual contacts.
Those numbers tell different stories.
Keep them separate.
Metric #2: Emails Sent
This is your activity number.
Useful, but not impressive by itself.
If a salesperson sends 2,000 emails and gets no conversations, the number 2,000 does not mean the campaign was productive.
Still, it gives context.
If you generated five meetings, you need to know whether those five came from:
50 emails.
500 emails.
5,000 emails.
That completely changes the economics.
Metric #3: Delivery Rate
Delivery rate tells you how many messages were accepted rather than bouncing.
A simple calculation is:
Delivered emails ÷ Emails sent × 100
Suppose you send 1,000 emails.
950 are delivered.
Your delivery rate is:
95%.
If that number starts dropping, investigate.
Common causes include:
Old contact data.
Incorrect email addresses.
Bad email patterns.
Expired domains.
Low-quality purchased lists.
Technical sending problems.
I would not ignore bounce problems and simply keep increasing volume.
Bad data should be fixed at the source.
Metric #4: Bounce Rate
Bounce rate is basically the opposite view.
You can calculate:
Bounced emails ÷ Emails sent × 100
Not all bounces mean the same thing.
A hard bounce usually indicates something more permanent, such as:
Mailbox does not exist.
Domain does not exist.
Address is invalid.
A soft bounce may be temporary.
Examples include:
Mailbox full.
Server temporarily unavailable.
Message temporarily rejected.
Your email platform may classify these automatically.
Tools such as NeverBounce, ZeroBounce, Hunter, and BriteVerify can help verify addresses before campaigns, although no verifier is perfect.
If your bounce rate suddenly increases after using a new lead source, that is useful information.
The list source may be the problem.
Metric #5: Open Rate — Use With Caution
I used to pay far too much attention to open rate.
It felt easy.
A high open rate meant the subject line was good.
A low open rate meant the subject line was bad.
Unfortunately, it is not that simple anymore.
Email privacy features and automatic image loading can make open tracking less reliable.
For example, a tracking pixel may load without a person actually reading the email.
Or an email may be genuinely opened without being tracked normally.
So I still look at open rate when available, but I treat it as directional rather than absolute.
I would never make a major campaign decision based only on opens.
Replies tell me much more.
Metric #6: Reply Rate
Reply rate is one of the first metrics I really care about.
The simple version is:
Replies ÷ Delivered emails × 100
If 500 emails are delivered and 25 people reply:
25 ÷ 500 × 100 = 5%
That gives you a 5% reply rate.
But even this metric has a problem.
Not all replies are good replies.
You may receive:
“Interested.”
“Send details.”
“Not interested.”
“Wrong person.”
“Remove me.”
“Out of office.”
Those should not all be treated equally.
That leads to the next metric.
Metric #7: Positive Reply Rate
This is much more useful than total reply rate.
Define what a positive reply means before launching.
Examples:
Interested in learning more.
Asked for pricing.
Requested examples.
Agreed to a call.
Referred you to the correct person.
Said to follow up at a specific future time.
Then calculate:
Positive replies ÷ Delivered emails × 100
Suppose:
1,000 emails delivered.
50 total replies.
15 positive replies.
Your total reply rate is:
5%.
Your positive reply rate is:
1.5%.
That second number tells you far more about actual campaign quality.
Categorize Replies
I highly recommend categorizing replies instead of leaving them as random notes.
A simple system could be:
Positive
Not interested
Wrong person
Already have provider
Not now
Unsubscribe
Out of office
Invalid contact
Other
This lets you identify patterns.
Suppose 30% of replies say:
“Wrong person.”
That suggests a targeting problem.
If many say:
“We already use another agency.”
Maybe you need a better replacement or backup-provider angle.
If many say:
“Try me in Q4.”
Your offer may be relevant, but timing is the issue.
Reply categories turn rejection into useful data.
Metric #8: Qualified Reply Rate
Not every positive response is actually qualified.
Someone might say:
“Sure, send me pricing.”
Then you discover they have a $100 budget for a $5,000 service.
That is technically interest.
It is not necessarily a qualified opportunity.
Define what qualification means for your business.
It may include:
Company size.
Budget.
Location.
Need.
Decision-making authority.
Timeline.
Technology requirements.
Then track how many replies actually match those criteria.
This prevents your team from celebrating conversations that were never likely to become customers.
Metric #9: Meetings Booked
This metric is straightforward.
How many outreach prospects booked a meeting?
You can calculate:
Meetings booked ÷ Delivered emails × 100
or:
Meetings booked ÷ Positive replies × 100
Both are useful.
The first measures overall campaign effectiveness.
The second measures how well your conversations convert into meetings.
Suppose:
1,000 emails delivered.
20 positive replies.
10 meetings booked.
Your email-to-meeting rate is:
1%.
Your positive-reply-to-meeting rate is:
50%.
Now you can see where the funnel is working.
Metric #10: Show Rate
Booking meetings feels great.
But booked meetings are not the same as attended meetings.
Track:
Meetings attended ÷ Meetings booked × 100
If you book 20 meetings and only 8 happen, you have a show-rate problem.
That might require:
Better reminders.
Clearer meeting confirmation.
Better qualification.
Less time between booking and the call.
Calendar invites.
SMS reminders where appropriate.
Tools such as Calendly, HubSpot Meetings, Google Calendar, and Microsoft Outlook can help manage scheduling.
But the real fix is understanding why people are disappearing.
Metric #11: Opportunities Created
A meeting is only useful if there is a realistic business opportunity.
After the call, classify the outcome.
For example:
Qualified opportunity.
Unqualified.
Follow up later.
No fit.
Lost to competitor.
Needs proposal.
Then track how many actual sales opportunities came from the campaign.
This is the point where marketing activity begins becoming sales pipeline.
Metric #12: Proposal Rate
For service businesses, proposals are often an important stage.
Track:
How many qualified meetings result in proposals?
If you have:
20 qualified meetings.
15 proposals.
That may be healthy depending on your sales process.
If only two receive proposals, either qualification is weak or the sales conversation is not progressing.
Metric #13: Close Rate
This is where the campaign starts becoming financially meaningful.
Calculate:
Customers won ÷ Qualified opportunities × 100
or:
Customers won ÷ Proposals sent × 100
Pick the version that fits your process.
Suppose:
20 opportunities.
5 customers.
Your opportunity close rate is:
25%.
That tells you something cold email metrics alone cannot.
You may discover that one campaign generates fewer meetings but much higher-quality prospects.
That campaign may be the real winner.
Metric #14: Revenue Generated
Eventually, this is what matters.
Track how much closed revenue came from cold outreach.
Not estimated pipeline.
Actual revenue.
If your campaign generated:
8 customers
at an average first-sale value of $2,500
that is:
$20,000 in revenue.
Now you can compare it against costs.
Metric #15: Pipeline Value
Revenue can take time, especially for B2B services.
Pipeline value helps you see opportunities that have not closed yet.
Suppose cold outreach creates:
Opportunity A: $5,000
Opportunity B: $10,000
Opportunity C: $7,500
Total pipeline:
$22,500
You may also track weighted pipeline.
For example, if Opportunity B has a 50% probability of closing:
$10,000 × 50% = $5,000 weighted value.
Do not treat pipeline as guaranteed revenue.
It is a forecasting tool.
Metric #16: Cost Per Meeting
This is where outreach becomes easier to compare with paid advertising or other acquisition channels.
Add the cost of:
Prospecting tools.
Data.
Email verification.
Outreach software.
Domains and mailboxes.
Sales labor.
Research time.
Then calculate:
Total campaign cost ÷ Meetings booked
Suppose the campaign costs $1,000.
You book 20 qualified meetings.
Cost per meeting:
$50.
Now you have a useful business number.
Metric #17: Cost Per Opportunity
This can be more meaningful than cost per meeting.
Formula:
Campaign cost ÷ Qualified opportunities
If the campaign costs $1,000 and generates five qualified opportunities:
Cost per opportunity = $200.
That tells you what it costs to create actual pipeline.
Metric #18: Customer Acquisition Cost
If the campaign generates customers, track customer acquisition cost.
Simplified formula:
Total sales and outreach cost ÷ New customers acquired
Suppose:
Campaign and sales cost = $4,000.
Customers won = 4.
CAC = $1,000.
If each customer is worth $10,000, that may be excellent.
If each customer is worth $500, you have a problem.
This is why reply rate alone means very little without economics.
Compare Results by Segment
This is where cold outreach reporting becomes extremely useful.
Do not just track the campaign overall.
Compare groups.
For example:
Dentists.
Roofers.
Law firms.
HVAC companies.
You may discover:
Dentists: 1.2% positive replies.
Roofers: 4.5%.
Law firms: 0.7%.
That tells you where the market is responding.
Now go deeper.
Compare by:
Company size.
Location.
Job title.
Industry.
Offer.
Pain point.
Lead source.
Personalization method.
Your best market may not be the one you originally expected.
Compare Decision-Makers
Suppose you sell marketing services.
You contact:
Owners.
Marketing managers.
CMOs.
Now compare.
Maybe owners reply more often but marketing managers create more qualified opportunities.
That is important.
A higher reply rate does not automatically mean better targeting.
Measure down the funnel.
Track Lead Source
If you build prospects using several sources, add a source field.
Examples:
Google Maps.
Apollo.
LinkedIn.
Sales Navigator.
Referral.
Industry directory.
Manual research.
Then compare performance.
You may find:
Apollo leads are cheaper to collect.
Google Maps leads convert better.
LinkedIn research produces more qualified accounts.
Now you can decide where research time should go.
Without source tracking, all leads look the same.
Track Campaign Version
Whenever you change messaging, label the version.
For example:
SEO_V1
SEO_V2
SEO_V3
Do not overwrite the old campaign and forget what changed.
Track:
Subject line.
Opening.
Offer.
CTA.
Audience.
Follow-up sequence.
Then compare performance.
This turns cold outreach into structured experimentation rather than random rewriting.
Test One Major Thing at a Time
I made this mistake early.
A campaign underperformed.
So I changed:
Subject line.
Email body.
CTA.
Audience.
Offer.
Follow-up timing.
Then results improved.
Great.
But I had no idea why.
If you want useful testing, change one major variable at a time when practical.
For example:
Version A CTA:
“Worth sending the details?”
Version B CTA:
“Open to a 15-minute call?”
Now you can compare.
If you change the CTA, audience, and subject line together, the test becomes difficult to interpret.
Track Follow-Up Performance Separately
This is extremely useful.
Your outreach platform may show which sequence step generated the reply.
Track:
Initial email replies.
Follow-up 1 replies.
Follow-up 2 replies.
Follow-up 3 replies.
Suppose the results are:
Initial email: 12 positive replies.
Follow-up 1: 8.
Follow-up 2: 5.
Follow-up 3: 1.
That tells you follow-ups are contributing significantly.
Now imagine follow-ups four through eight generate no positive replies and several complaints.
That may tell you the sequence is too long.
Data helps you decide where to stop.
Track “Not Now” Leads
These are often ignored.
Do not treat:
“Contact me in October.”
as a lost lead.
Create a status such as:
Future follow-up.
Then add the date.
Use your CRM or Google Calendar to remind you.
Some of the easiest sales come from prospects who already told you when to return.
Tools such as HubSpot, Pipedrive, Salesforce, Close, Zoho CRM, and similar platforms can automate these reminders.
Even a spreadsheet with a next_follow_up column works if you actually check it.
Track Referrals to Other Decision-Makers
Suppose you email the CEO.
They reply:
“Speak with Rachel, our Marketing Director.”
That is not a failure.
I would classify it separately.
Something like:
Referred internally.
Why?
Because this tells you two things.
The account may be relevant.
But your original persona may have been wrong.
If this happens frequently, you can change your future targeting.
Use a CRM Once the Spreadsheet Gets Messy
Google Sheets is fine in the beginning.
A simple sheet might include:
First Name
Last Name
Company
Job Title
Industry
Lead Source
Campaign
Date Sent
Reply Status
Reply Category
Meeting Booked
Meeting Attended
Opportunity
Proposal
Closed
Revenue
Next Follow-Up
Notes
That works surprisingly well.
But once you have several campaigns and multiple salespeople, a CRM becomes much easier.
Popular options include:
HubSpot.
Pipedrive.
Close.
Zoho CRM.
Salesforce.
Choose based on your workflow rather than buying the platform with the most features.
A CRM nobody updates is worse than a spreadsheet everyone uses.
Connect Outreach Software to Your CRM
If possible, avoid manually copying every reply and meeting between systems.
Many outreach platforms integrate with CRMs directly or through tools such as Zapier and Make.
For example:
Cold email platform sends message.
Prospect replies positively.
Lead status updates in CRM.
Meeting is booked.
Opportunity is created.
Sale closes.
Revenue is attributed back to the campaign.
That creates much better reporting.
Automation should reduce administrative work.
It should not replace judgment.
UTM Parameters Help When Prospects Visit Your Website
If your cold outreach includes links, UTM parameters can help identify traffic in analytics tools such as Google Analytics.
A URL might include campaign information indicating:
Source: cold_email
Medium: outbound
Campaign: roofing_august
This helps you see whether cold outreach prospects visit:
Pricing.
Case studies.
Service pages.
Contact forms.
But I would not overload first-touch cold emails with unnecessary links just for tracking.
Tracking is useful only when it does not damage the experience.
Track Form Submissions Properly
Sometimes prospects do not reply to the email.
They visit your website and submit a contact form.
If you only track email replies, you may miss that conversion.
Ask:
“How did you hear about us?”
or pass campaign data into your analytics/CRM when technically possible.
This can reveal conversions that your outreach platform never sees.
Call Tracking Can Help With Multi-Channel Outreach
If your campaign combines cold email and cold calling, make sure outcomes are captured in the same system.
Otherwise, attribution gets messy.
Someone might:
Receive an email Monday.
Get a call Wednesday.
Visit your website Thursday.
Book a meeting Friday.
Which channel gets credit?
There is no perfect answer.
But you should at least keep the contact history together.
CRMs such as HubSpot, Close, Salesforce, and Pipedrive can help centralize activity depending on your phone and email setup.
Do Not Let Open Tracking Dictate Follow-Ups
I used to see:
“Prospect opened email five times.”
and assume:
“They are definitely interested.”
Not necessarily.
Privacy systems may generate opens.
Someone may have forwarded the email.
The prospect may simply have reopened it without serious intent.
Do not send:
“I noticed you opened my email five times.”
That feels invasive.
Use open data internally if useful.
Base the actual follow-up on the conversation and business context.
Create a Weekly Outreach Report
You do not need a 40-page dashboard.
A simple weekly report might include:
Prospects contacted: 500
Delivered: 475
Total replies: 35
Positive replies: 12
Qualified replies: 9
Meetings booked: 6
Meetings attended: 5
Opportunities: 3
Closed customers: 1
Pipeline created: $18,000
Revenue closed: $4,000
Bounces: 25
Opt-outs: 8
Now add a few observations:
Roofing companies performed best.
Founder outreach produced more replies.
Marketing managers produced better qualified meetings.
Follow-up #2 generated three positive conversations.
That is a useful report.
It tells you what to do next.
Separate Leading and Lagging Metrics
Some metrics appear quickly.
These are leading indicators.
Examples:
Delivery.
Replies.
Positive replies.
Meetings.
Other metrics take longer.
These are lagging indicators.
Examples:
Opportunities.
Deals.
Revenue.
Customer lifetime value.
Do not shut down a high-ticket B2B campaign after one week because it has not generated revenue yet if the sales cycle takes two months.
But also do not celebrate indefinitely because people keep replying.
You eventually need pipeline and customers.
Look at both types of metrics.
Watch the Quality of Meetings
Meeting count can become another vanity metric.
Suppose Campaign A generates:
15 meetings.
Only 2 are qualified.
Campaign B generates:
8 meetings.
6 are qualified.
Which is better?
Probably Campaign B.
This is why I like tracking:
Booked meetings.
Attended meetings.
Qualified meetings.
Separately.
Otherwise sales teams start booking anyone who says yes simply to improve the dashboard.
Track No-Show Reasons
If possible, look at why people miss calls.
Did they:
Forget?
Reschedule?
Lose interest?
Book by accident?
Decide the service was irrelevant?
Patterns can reveal problems.
For example, a very aggressive CTA may get more calendar bookings but weaker show rates.
That means the extra meetings were not necessarily valuable.
Compare Revenue by Campaign
Suppose you run two campaigns.
Campaign A:
2,000 emails.
20 meetings.
2 customers.
$3,000 revenue.
Campaign B:
800 emails.
8 meetings.
3 customers.
$18,000 revenue.
If you only look at meetings, Campaign A appears bigger.
If you look at revenue, Campaign B is dramatically stronger.
Track the entire customer journey.
Track Customer Quality Too
This becomes important over time.
A campaign may generate clients who:
Churn quickly.
Pay late.
Demand excessive support.
Have poor margins.
Another campaign may bring long-term, high-value customers.
Eventually you can compare:
Customer lifetime value.
Retention.
Profit margin.
Expansion revenue.
That is advanced reporting, but it can completely change which audience you consider “best.”
Common Cold Outreach Tracking Mistakes
Obsessing Over Open Rate
Useful sometimes, but unreliable and incomplete.
Treating Every Reply as Positive
“Remove me” is technically a reply.
It is not a lead.
Not Tracking Revenue
Activity without financial outcomes can be misleading.
Mixing Different Campaigns Together
Keep campaign versions identifiable.
Forgetting Lead Source
You need to know where good prospects come from.
Ignoring Follow-Up Attribution
Later emails may be doing more work than you think.
Counting Booked Calls Instead of Qualified Calls
Meeting quality matters.
Changing Too Many Variables at Once
You lose the ability to learn.
Not Tracking Opt-Outs
This is both an operational and compliance problem.
Forgetting Long-Term Opportunities
“Call me next quarter” should not disappear.
A Simple Cold Outreach Tracking Setup
If I were starting from scratch today, I would keep it simple.
Step 1: Define the Goal
For example:
Qualified sales meetings.
Step 2: Define Your Funnel
Prospect → Delivered → Reply → Positive Reply → Meeting → Opportunity → Customer.
Step 3: Define Reply Categories
Positive.
Negative.
Wrong person.
Not now.
Already covered.
Opt-out.
Step 4: Add Campaign Labels
Know exactly which message each prospect received.
Step 5: Track Lead Source
Apollo, LinkedIn, Google Maps, manual research, referral, etc.
Step 6: Track Sales Outcomes
Do not stop tracking at the meeting.
Step 7: Review Weekly
Look for patterns.
Step 8: Change One Important Variable
Adjust based on evidence.
Step 9: Repeat
That is how campaigns improve.
The Numbers Should Tell You What to Fix
This is the main reason to track anything.
Every metric should help answer a question.
High bounce rate?
Fix the data.
Good delivery, weak replies?
Review targeting and copy.
Many replies, few positive ones?
Your message may create attention but not relevance.
Positive replies, few meetings?
Review the CTA or qualification process.
Many meetings, few opportunities?
The wrong people may be booking.
Many opportunities, few sales?
Review pricing, sales process, positioning, or competitive fit.
Good sales but poor profit?
You may be targeting the wrong customer type.
That is what good tracking does.
It moves the conversation from:
“I think the campaign is bad.”
to:
“The list is good, but the offer is not converting marketing managers.”
That is a problem you can actually work on.
Track Enough to Learn, Not So Much That You Stop Selling
There is also a danger in going too far.
I have seen reporting systems with dozens of metrics nobody uses.
Dashboard tabs.
Charts.
Custom scores.
Weekly spreadsheets.
Nobody could explain which number actually changed a decision.
You do not need to measure everything.
Start with:
Delivered.
Bounces.
Replies.
Positive replies.
Qualified conversations.
Meetings.
Opportunities.
Customers.
Revenue.
Cost.
Then add more detail only when it helps answer a real business question.
The point of tracking cold outreach is not creating beautiful reports.
It is figuring out:
Who responds.
Why they respond.
Which campaigns create opportunities.
Which opportunities turn into customers.
And whether the money you make is worth the effort you put in.
Once you can answer those questions, cold outreach becomes much less mysterious.
You stop guessing whether changing one sentence “felt better.”
You can see what happened.
And that is when outbound starts becoming repeatable rather than something you restart from zero every month.